Reduction of air emissions
Activity of such industrial enterprises as KPO is always associated with air emissions. High concentration of toxic substances in the air leads to environmental degradation. In that regard, KPO has set the goal to reduce the negative effect of its activities.
KPO manages air emissions based on the limits established in the Environmental Emissions Permit. Most emissions are generated as a result of combustion of fuel gas in gas turbine units, boilers, process heaters, compressors, and gas and liquid flaring.
Tab. 28. Targets in environmental protection
|
Our 2020 targets |
Target achievement |
Actions taken in 2020 |
Targets for 2021 |
|
AIR EMISSIONS |
|||
|
Ensure that specific GHG emissions do not exceed 67 tonnes of СО2 per one thousand tonnes of produced hydrocarbons |
Completed |
Specific GHG emissions amounted to 62 tonnes of CO2 per one thousand tonnes of produced hydrocarbons |
Ensure that specific GHG emissions do not exceed 67 tonnes of СО2 per one thousand tonnes of produced hydrocarbons |
|
Achieve reduction of GHG emissions by 285 thousand tonnes of СО2 |
Completed by 88 % |
Greenhouse gas emissions were reduced by 251 thousand tonnes of CO2. The target was not achieved as the well operations activities were suspended in Q3 due to the COVID quarantine. |
|
|
Ensure that the throughput losses do not exceed 3.82 % |
Completed |
Throughput losses amounted to 3.61 %. |
Ensure that the throughput losses do not exceed 3.82 % |
In 2020, cumulative air emissions totalled 7,591 tons, i.e. it remained the same as last year. Table 29 shows data on the permissible and actual KPO’s emissions for the period of 2018–2020.
Tab. 29. Permitted and actual volumes of pollutant emissions, 2018–2020
|
Annual volume of emissions by pollutants, in tonnes: |
2018 |
2019 |
2020 |
|
Permitted: |
19,986 |
18,544 |
17,527 |
|
Actual, including: |
7,759 |
7,597 |
7,591 |
|
Nitrogen oxides |
1,931 |
1,636 |
1,637 |
|
Sulphur dioxide |
3,138 |
3,281 |
3,315 |
|
Carbon monoxide |
1,249 |
1,205 |
1,145 |
|
Volatile organic compounds |
1,315 |
1,329 |
1,352 |
|
H2S |
3 |
3 |
3 |
|
Solid particles |
65 |
80 |
74 |
|
Other |
58 |
63 |
65 |
Note: Emission volumes data are provided in accordance with the data of statistical report «2-TP Air»
In KPO, emissions are calculated using the technics specified in the statutory emissions limits and recommended for use in the Republic of Qazaqstan.
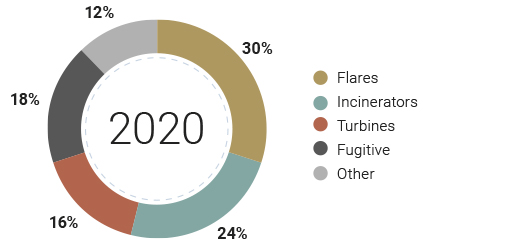
Graph No 17 shows pollutants emissions broken down by main air pollution sources.
Graph 17. Distribution of pollutant emissions in KPO by main air pollution sources, in 2020
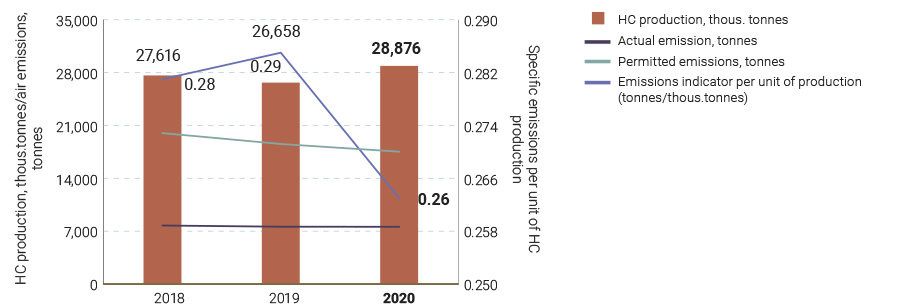
In 2020, the specific emissions per unit of production amounted to 0.26 tonnes per 1,000 tonne of hydrocarbons (HC) produced. Reduction in specific emissions in 2020 versus 2019 is attributed to higher production uninterrupted by shutdowns and increased gas injection levels.

Graph. 18. Hydrocarbons production and environmental emissions in 2018–2020
GAS FLARING
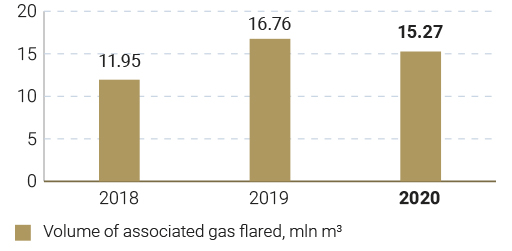
In 2020, the total amount of flared gas was 0.08 % (0.09 % in 2019) of the total volume of gas produced or 0.47 tonnes per thousand tonnes of produced hydrocarbons. Such a low flaring emission rate resultant from flaring testifies to high operational performance against the global industrial average rate of 10.6 tonnes per one thousand tonnes and European average rate of 5.5 tonnes per one thousand tonnes12, as follows from the IOGP 2019’s Report. Reduction in gas flaring volumes versus 2019 was due to the fact that a full turnaround was skipped in 2020.
In 2020, KPO used high volume gas fraction pumps (HVGF) for pumping liquids. The use of such equipment and materials has allowed decreasing the volume of liquids flaring by 26 thousand tonnes, which used to make 93 % of the entire volume produced during the well clean-up operations. Thus, the volume of flared gas has decreased by 15 mln m3 (or 49 % of the volume produced during the well clean-ups).
Gas Utilization
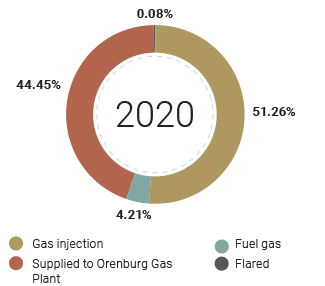
In 2020, KPO’s gas utilization rate reached 99.92 % (99.91 % in 2019). The performance target approved by the RoQ Authority under the 2020 Associated Gas Processing Development Programme was 99.58 %.
Direct greenhouse gas emissions
Across KPO the direct greenhouse gas (GHG) emissions are regulated under the national quotas trading system. KPO obtained quotas for 2018–2020 GHG emissions (CO2) in the amount of 6,927,159 tonnes on the basis of specific emissions indicators (benchmark). In 2018 – 2020, total actual emissions amounted to 5,242,018 tonnes of CO2, which made 76 % of the quota.
Assessment of GHG emissions is performed for carbon dioxide (СО2), methane (СН4) and nitrogen oxide (N2O), using the calculation method on the basis of the Company’s operations data (in terms of fuel consumption and laboratory data on fuel composition).
According to the verified GHG Emissions Inventory Report for 2020, the total volume of GHG emissions amounted to 1,821,604 tonnes in СО2-equivalent, of which СО2 contribution equalled to 1,800,774 tonnes of СО2-equivalent (98.9 %), CH4 – 11,993 tonnes of С?О2-equivalent (0.6 %), N2O – 8,837 tonnes of СО2-equivalent (0.5 %).
Information on the dynamics of generated GHG emissions is provided in table 30. A small reduction in GHG emissions (by 2.6 %) in 2020 versus 2019 is attributed to the changes to the fugitive emissions methodology described in Case Study .
Graph 19. Volume of associated gas flared, 2018– 2020 (mln m3)
Graph 20. Gas utilization and flaring in 2020
12 Data source: Annual reports of the International Association of Oil and Gas Producers (IOGP) – ‘Environmental Performance Indicators – 2018 Data’
Tab. 30. Dynamics of GHG emissions generated as a result of KPO production activities, 2018–2020
|
Total volume of greenhouse gas emissions (tonnes of CO2 equivalent) |
|||||
|
From fuel combustion at flares and incinerators |
From fuel combustion at stationary sources |
Fugitive emissions* |
Total GHG emissions in 2020 |
Total GHG emissions in 2019 |
Total GHG emissions in 2018 |
|
141,954 |
1,670,399 |
9,251 |
1,821,604 |
1,870,324 |
1,893,447 |
|
* Considering the use of internal calculation methodology for fugitive GHG emissions approved for use for the purposes of inventory by the RoQ Ministry of Environment, Geology and Natural Resources. The volume of figutive GHG emissions in 2020 calculated by the methodology applied at the GHG emissions inventory for 2018–2029 made up 161,782 of CO2-equivalent. |
|||||
Specific greenhouse gas emissions
In 2020, KPO specific GHG emissions amounted to 62 tonnes of СО2 per thousand tonnes of produced hydrocarbons, which is fully consistent with the target indicators of the specific GHG emissions of no more than 67 tonnes of CO2 per thousand tonnes of hydrocarbon produced.
Graph 21 shows the dynamics of specific GHG emissions comparing to the specific emissions data provided by the IOGP. The actual specific GHG emissions at KPO are 23 % lower than the European indicators and 52 % lower than the international ones.
Reduction of greenhouse gas emissions
In 2020, as part of consistent reduction of GHG (CO2) emissions, KPO set the target to reduce direct GHG emissions by 285 thousand tonnes through implementation of a number of production optimization and energy efficiency projects.
Owing to implementation of the seven projects listed in table 31, the actual reduction of the GHG emissions was 88 % of the planned target. The target was not achieved due to restrictions on well operations introduced in Q3 2020 due to quarantine.
Graph. 21. Dynamics of specific GHG emissions per unit of produced hydrocarbons (HC)*
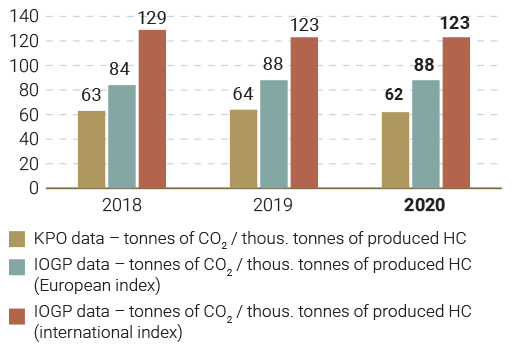
* The data was sourced by Annual report of the International Associations of Oil and Gas Producers (IOGP) – “Environmental Performance Indicators – 2019 data”. The 2019 data was used for comparison purpose in 2020, as the 2020 IOGP Report was not available at the time this issue was prepared
Tab. 31. GHG emissions’ reduction measures in 2020
|
No |
Activity |
GHG emissions’ reduction, tonnes/year |
Status of completion, % |
|
|
Target |
Actual |
|||
|
1 |
Use of high pressure separator during well clean-up* |
219 |
10 |
5 % |
|
2 |
Use of high pressure pump during well clean-up |
9 |
0.4 |
4 % |
|
3 |
Use of oil based fluid for reservoir stimulation |
10 |
11.5 |
120 % |
|
4 |
Use of high volume gas fraction pump (HVGF) |
6 |
108.6 |
1,817 % |
|
5 |
Repair of flare headers valves at KPC |
19 |
26 |
137 % |
|
6 |
Adjustment of steam flow meter at Train 4 |
10 |
21.6 |
220 % |
|
7 |
Upgrade of Unit 2 turbo-compressors piping |
13 |
73.1 |
562 % |
|
|
Total: |
286 |
251.2 |
88 % |
* The target to reduce GHG emissions for 2020 was not fully completed due to СOVID quarantine restrictions; the activity with a high-pressure separator was applied only at well № 9870 instead of 11 wells as planned.
CASE STUDY 11
DEVELOPMENT OF A METHODOLOGY FOR CALCULATING FIGUTIVE GREENHOUSE GAS EMISSIONS
Context / short description:
Based on the outcomes of the fugitive GHG Emissions Monitoring Campaign from 2015 to 2019 it was identified that the actual GHG (methane) emissions are significantly lower (by 93 %) than GHG emission volumes calculated in line with the Guidelines on GHG Air Emissions Calculation for Gas Production, Transportation and Storage Facilities. Based on the provisions of the Article 94-11 of the RoQ Environmental Code and ST RQ GOST R ISO 14064-1-2010, KPO took a decision to develop its own methodology that would allow to utilize the outcomes of the monitoring and therefore minimize indeterminacy in future calculations of fugitive GHG emissions at the Karachaganak field facilities.
Goal:
KPO’s own methodology will support the delivery of the following objectives:
- It will enable for calculations of actual fugitive GHG emissions at a more advanced level based on the screening and monitoring data,
- It can be utilized during annual GHG emissions inventory at the Karachaganak field production facilities.
Solution / actions:
Considering the internal developed materials and based on the provisions of the Guidelines EPA-453/R-95-017, KPO Environmental Department has done huge work to develop and implement the Fugitive GHG Emissions Calculation Methodology. For this purpose, the following materials were studied and taken into consideration:
- Equipment Leak Evaluation Guidance materials issued by the USA Environmental Protection Agency (EPA-453/R-95-017).
- KPO Internal Fugitive Emissions Monitoring procedures and Fugitive Emissions Calculation Procedure.
- KPC, Unit-2 and Unit-3 fugitive emissions screening and monitoring results.
The new methodology was approved by the Ministry of Environment, Geology and Natural Resources of the Republic of Qazaqstan for using during the GHG emissions inventory at the Karachaganak field production facilities.
Result:
- The new methodology will enable KPO to obtain a more reliable data on the fugitive GHG (methane) emissions in Karachaganak;
- The methodology was applied during the GHG emissions inventory in 2020. According to the 2020 Inventory Report, application of this methodology allowed for reducing cumulative reportable KPO GHG emissions at least by 150 kt CO2 equivalent or by 8 %